Database Optimization Tool
PostgreSQL optimization method

How optimization works

Database Optimization Tool turns PostgreSQL evidence into reviewable recommendations by separating collection, classification, recommendation, and validation. The workflow is built for teams that want useful database direction without handing over production control.

Default boundary
read-only collector, manual upload, no production writes
Best evidence
EXPLAIN, pg_stat_statements, table/index stats, and benchmark artifacts
Signal coverage

The report says where its confidence comes from.

Strong evidence narrows the recommendation. Missing evidence stays visible as a coverage note instead of being hidden behind a confident-sounding answer.

pg_stat_statements

Ranks normalized query pressure by calls, total time, mean time, rows, temp writes, and reset caveats.

Strongest query history signal
EXPLAIN

Shows scans, joins, sorts, buffers, filters, row estimates, and whether a candidate fix changes the actual plan.

Plan-backed review path
Table and index stats

Connects relation size, seq scans, index scans, dead rows, last analyze, and unused-index cost.

Works with restricted roles
Missing signals

Marks unavailable extensions, blocked views, absent EXPLAIN, stale stats, or managed Postgres visibility limits.

Coverage note, not guesswork
Trust boundary

Safety is part of the product surface.

read-only collector

The local collector is designed around restricted PostgreSQL users and no production writes.

manual upload

Generated files stay local until your team reviews them and chooses to attach them to a project.

no production writes

The website does not create indexes, run VACUUM, change settings, or execute production rollout steps.

explicit consent

Any command path that can execute SQL requires a clear local consent flag and a staging or sandbox mindset.

Concrete use cases

Optimization starts from the user-visible slowdown.

Slow dashboard

Signal
Repeated scans, sort pressure, temp writes, and offset pagination.
Next step
Candidate index or rewrite, plus EXPLAIN checks before a rollout.

Write-heavy table

Signal
Unused indexes, hot relations, dead-row pressure, and rising maintenance cost.
Next step
Review whether reads justify write overhead before dropping or adding indexes.

Managed Postgres

Signal
RDS, Cloud SQL, Supabase, or Neon may hide privileged settings and host metrics.
Next step
Keep useful low-privilege evidence while marking the gaps clearly.

Staging validation

Signal
Before/after SQL, fixture plan, EXPLAIN samples, and benchmark artifact.
Next step
Compare the change outside production and package a handoff for the owner.
Evidence levels

A rough idea should not look like a validated production result.

LevelInputMeaning
problem-onlyUser symptomDirectionally useful, not enough for a production change.
SQL draftSlow SQL textHighlights query shape, joins, filters, sorts, and pagination risk.
schema-backedSQL plus table shapeSupports candidate index or rewrite discussion.
plan-backedEXPLAIN evidenceConnects a recommendation to actual planner behavior.
collector-backedaudit.jsonUses workload and table/index history, not a single query guess.
benchmark-backedstaging or sandbox artifactCompares before and after evidence before rollout.
Public toolkit

Open the local evidence layer, keep the SaaS product private.

The public GitHub repository makes `postgresaudit` reviewable: CLI commands, synthetic examples, schemas, permission guidance, redaction notes, and smoke tests. It does not publish the production SaaS app.
Publicpostgresaudit CLI, command docs, synthetic examples, schemas, privacy notes, tests
PrivateSaaS backend, auth, billing, and AI workflow stay private
BoundaryThe public toolkit prepares local evidence. The website turns approved files into project review.
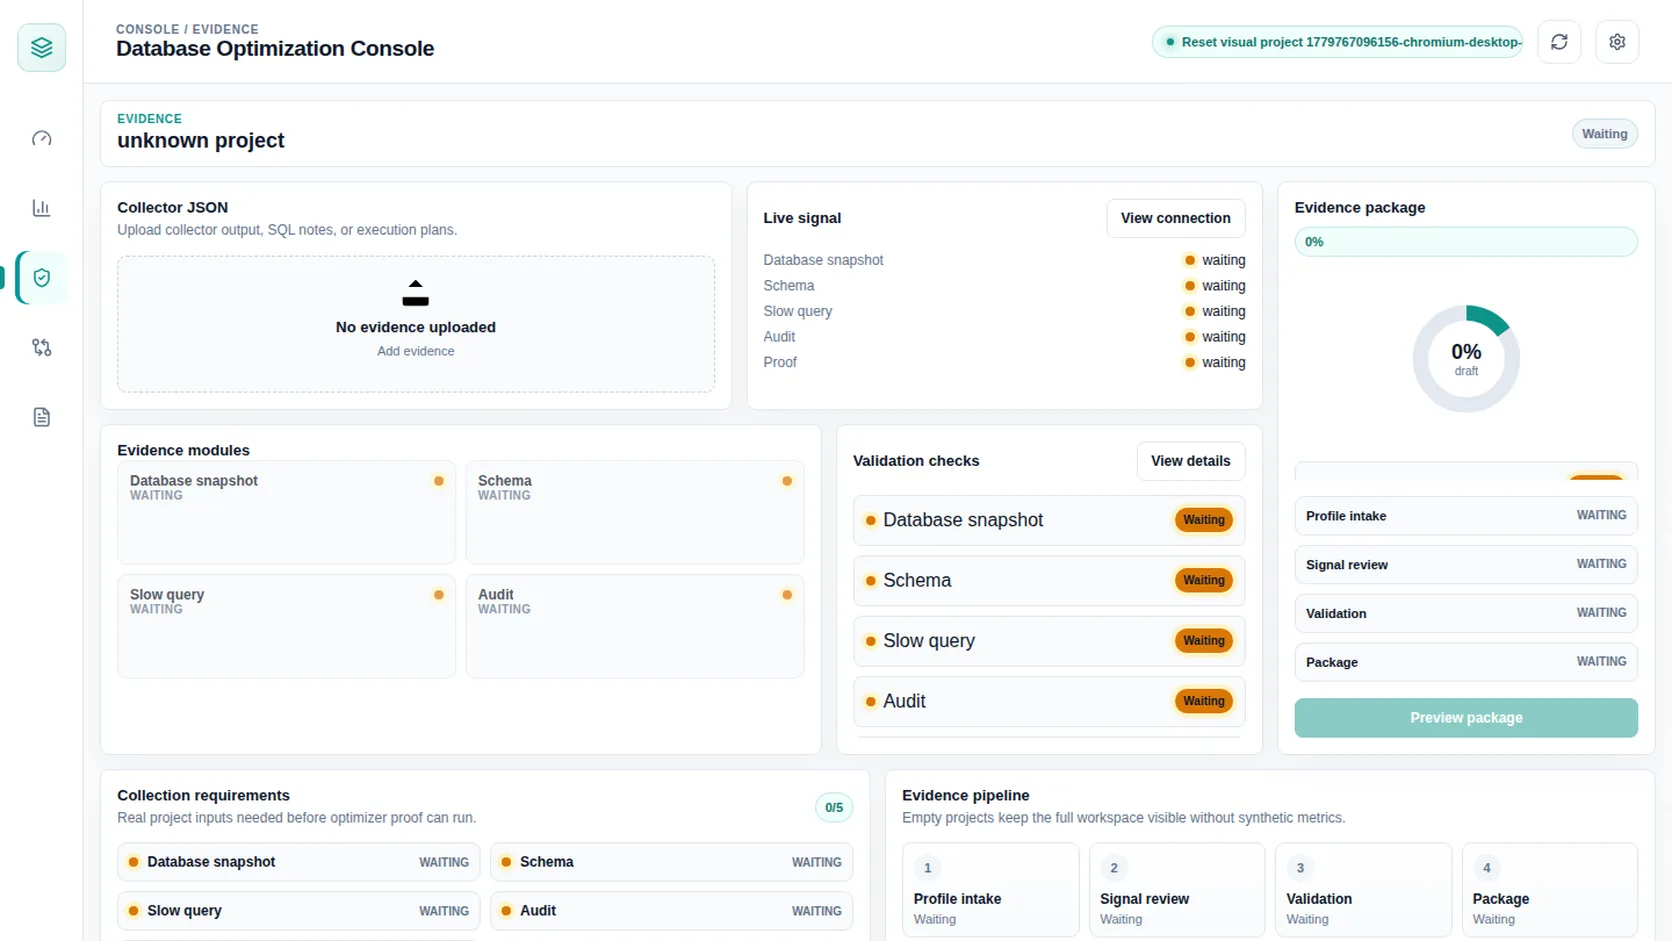
Database Optimization Tool collector evidence workspace preview
Try SQL previewRun the local collectorView GitHub toolkitRead local companion docsView sample report